Wealth Inequality in America – Critiques On Inequality

(UPDATED w/ Armstrong and Getty [3-24-2021])

Armstrong and Getty read from and discuss a bit an article in the WALL STREET JOURNAL entitled: The myth of American inequality (https://tinyurl.com/ymy5rjz9). Unfortunately the article is behind a pay-wall… but PECKFORD 42 has it for reading.

(UPDATED April 2014 and Today: 12-27-2020)

The below video is a “pop-culture” challenge to an economic principle that if the free-markets are left to choose (free contractual trade for services between people in the supply-and-demand market) would allow the most people to succeed as the innate abilities of people and the market can bare:

Prager University notes that “INEQUALITY IS GOOD”

What if everything you’ve heard about income inequality is wrong? What if it’s actually a good thing for there to be people who are rich and people who aren’t? John Tamny, editor of RealClearMarkets, clarifies one of the big misunderstandings of our time.

If you want a quick dealing with this instead of the more thoughtful look below, here is one excellent quickie:

Politicians and reporters often rail about “the rich getting richer and the poor getting poorer.” In fact, the incomes of poor and middle-income Americans are up 32% since the government began keeping track several decades ago (The Distribution of Household Income [CBO] – PDF). Yes, that increase is adjusted for inflation. Another misleading claim, says Stossel, is the idea that the U.S. “no longer has economic mobility.” But a paper in The Quarterly Journal of Economics found that most people born to the richest fifth of Americans fall out of that bracket within 20 years. (Table 2)) Likewise, most born to the poorest fifth climb to a higher quintile. Some climb all the way to the top.

AEI has a good critique of the video challenge at the top, I will follow this by a video response by Lee Doren:

A video titled Wealth Inequality in America has gone viral on the Internet, it’s up to almost four million views on YouTube. It’s not clear who produced it, and it’s not clear what solution is being proposed to the “problem” of wealth inequality identified in the video. What is clear is that it’s another fallacious, static analysis of wealth distribution that focuses only on abstract, statistical brackets at a given point in time, while completely disregarding the most important point: what is happening to actual flesh-and-blood human beings whose income and wealth change all the time and who are moving among the various abstract statistical brackets from year to year.

In the video above titled “What Wasn’t Said in ‘Wealth Inequality In America,’” Steve Horwitz responds to the Wealth Inequality video and reminds us that the most important issue is not what abstract statistical bracket people fall into in a given year, but rather the degree of income or wealth mobility from year to year. It’s an important point, and one that’s completely overlooked in the viral video.

Thomas Sowell has discussed extensively the issues of static versus dynamic analysis of wealth and income distributions, and income and wealth mobility, and here are some of his quotes as an antidote to the limited, static “analysis” of wealth inequality presented in the viral video:

1. Comparing the top income bracket with the bottom income bracket over a period of years tells you nothing about what is happening to the actual flesh-and-blood human beings who are moving between brackets during those years. Following trends among income brackets over the years creates the illusion of following people over time. But the only way to follow people is to follow people.  Source  

2. Sports statistics are kept in a much more rational way than statistics about political issues. Have you ever seen statistics on what percentage of the home runs over the years have been hit by batters hitting in the .320s versus batters hitting in the .280s or the .340s? Not very likely. Such statistics would make no sense, because different batters are in these brackets from one year to the next. You wouldn’t be comparing  people, you would be comparing abstractions and mistaking those abstractions for people.

But, in politics and in commentaries on political issues, people talk incessantly about how “the top one percent” of income earners are  getting more money or how the “bottom 20 percent” are falling behind. Yet the turnover in income brackets over a decade is at least as great  as the turnover in batting average brackets.  Source  

3. Only by focusing on the income brackets, instead of the actual people moving between those brackets, have the intelligentsia been able to verbally create a “problem” for  which a “solution” is necessary. They have created a powerful vision of  “classes” with “disparities” and “inequities” in income, caused by  “barriers” created by “society.” But the routine rise of millions of  people out of the lowest quintile over time makes a mockery of the  “barriers” assumed by many, if not most, of the intelligentsia.” Source 

4. Most people are not even surprised any more when they hear about someone who came here from Korea or Vietnam with very little money, and very little knowledge of English, who nevertheless persevered and rose in American society. Nor are we surprised when their children excel in school and go on to professional careers. Yet, in utter disregard of such plain facts, so-called “social scientists” do studies which conclude that America is no longer a land of opportunity, and that upward mobility is a “myth.” Source 

5. Most working Americans who were initially in the bottom 20 percent of income-earners, rise out of that bottom 20 percent. More of them end up in the top 20 percent than remain in the bottom 20 percent. People who were initially in the bottom 20 percent in income have had the highest rate of increase in their incomes, while those who were initially in the top 20 percent have had the lowest. This is the direct opposite of the pattern found when following income brackets over time, rather than following individual people. Source 

6. Most of the media publicize what is happening to the statistical brackets — especially that “top one percent” — rather than what is happening to individual people. Source 

Here is Lee’s response (Preserved by me!)

Lee Doren has a passion for public speaking, being the youngest speaker to lecture for the Ronald Reagan Political Lecture Series at Oberlin College. He has given speeches in Annapolis, Maryland on the Bill of Rights and at the U.S. Capitol for the 9/12 March on Washington. He has been invited to lecture at The Cato Institute, The Institute for Energy Research, the Young Britons’ Foundation in the United Kingdom, the State Policy Network and Lehigh University. He has also provided commentary for Fox News, CNN, Reuters, PBS and Air America.

I would recommend the following articles for further reading:


  1. YouTube Wealth Inequality Video Fails to Tell the Whole Story (Policy Mic);
  2. Why Inequality Doesn’T Matter: At Least Not Income Inequality (The Federalist);
  3. Inequality Fallacies: The Left Gets The Facts Wrong On Economic And Racial Disparities (National Review Online);
  4. Income Inequality Deception (Forbes);
  5. Dispelling Myths About Income Inequality (Forbes);
  6. The Five Biggest Myths About Income Inequality (Forbes);
  7. The Income-Inequality Myth: Reports Of Skyrocketing Incomes For The Wealthy And Stagnating Wages For The Rest Are Unfounded (National Review Online);
  8. The American Dream of Income Equality Still Lives (Scientific American);
  9. Debunking The Top Three Myths About Income Inequality (CNBC);
  10. Inequality Myths (CATO).
  11. Five Myths About Economic Inequality In America (CATO)

(This portion can also be found in the “Rich Get Richer/Poor Get Poorer” Mantra.) Larry Elder notes when this “widening” happened the most:

Here are some myth busting to help the layman researcher get more facts to respond to the pop-politics we run-across in our social media lifestyle. Investors Business Daily makes some key points that are hard to ignore:

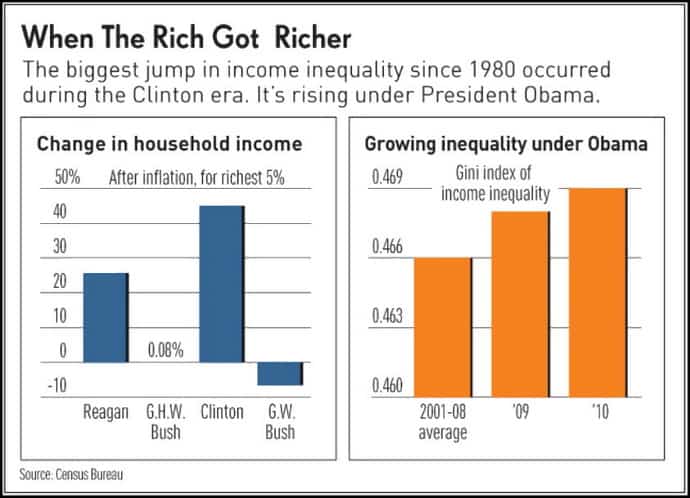
Income Inequality Rose Most Under President Clinton

But it turns out that the rich actually got poorer under President Bush, and the income gap has been climbing under Obama.

What’s more, the biggest increase in income inequality over the past three decades took place when Democrat Bill Clinton was in the White House.

The wealthiest 5% of U.S. households saw incomes fall 7% after inflation in Bush’s eight years in office, according to an IBD analysis of Census Bureau data. A widely used household income inequality measure, the Gini index, was essentially flat over that span. Another inequality gauge, the Theil index, showed a decline.

In contrast, the Gini index rose — slightly — in Obama’s first two years. Another Census measure of inequality shows it’s climbed 5.7% since he took office.

Meanwhile, during Clinton’s eight years, the wealthiest 5% of American households saw their incomes jump 45% vs. 26% under Reagan. The Gini index shot up 6.7% under Clinton, more than any other president since 1980

[….]

As University of Michigan economist Mark Perry notes, while the income gap has grown since 1979, almost the entire increase occurred before the mid-1990s: “There is absolutely no statistical support for the commonly held view that income inequality has been rising recently.”

A similar analysis found that income inequality has fallen among individuals since the early 1990s, but risen among households due to factors such as more marriages of people with similar education levels and earnings potential.

Others argue that income mobility matters more than equality.

One study found that more than half of the families who started in the lowest income bracket in 1996 had moved to a higher one by 2005. At the other end of the spectrum, more than 57% of families fell out of the top 1%.

…read more…

Another smaller post points out nearly the same:
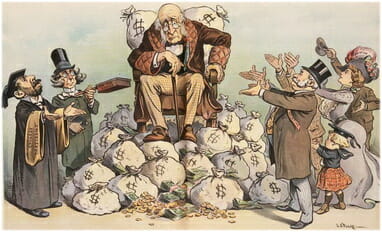
Busting The 1% Vs. 99% Myth

The left says current levels of income inequality echo the late 1920s and the Gilded Age. They’ve zeroed in on the richest 1%, citing Census Bureau data showing these top earners “grabbing” more income than the bottom 90%.

But the census stats are misleading.

For one, they are a snapshot of income distribution at a single point in time. Yet income is not static. It changes over time. Low-paying jobs from early adulthood give way to better-paying jobs later in life.

And income groups in America are not fixed. There’s no caste system here, really no such thing even as a middle “class.” The poor aren’t stuck in poverty. And the rich don’t enjoy lifetime membership in an exclusive club.

A 2007 Treasury Department study bears this out. Nearly 58% of U.S. households in the lowest-income quintile in 1996 moved to a higher level by 2005. The reverse also held true. Of those households that were in the top 1% in income in 1996, more than 57% dropped to a lower-income group by 2005.

Every day in America, the poor join the ranks of the rich, and the rich fall out of comfort.

So even if income equality is increasing, it does not mean income mobility is decreasing. There is still a great deal of movement in and out of the richest and poorest groups in America.

…read more…

Minimum Wage and Jobs (Who Is The Loser?)

PRO TIP: I use a browser separate from my go to that I can erase all the history and cookies in order to open up articles from sites (like Forbes or American Spectator) that regulate how many free articles you can access before a “pay wall” is set up and they block you from access to more. You may need to do this if you follow the links below.

In a continuing discussion [of sorts], some more articles regarding the Davis Bacon Act (coming in a future post) and minimum wage issues have been linked/levied. I do not have time to respond to them all, but I will to some of the major articles. Here I will extend the discussion about employment… but the gist of our positions are as follows:

An article linked by Chris L. was an enjoyable read is from FORBES. While I believe parts of it are wrong, it was a good, digestible size. (And the reason he linked it had to do with a “living wage” 9point #1], but the article – even there – does not support Chris’s contention. Linking that article is actually a train wreck for Chris L., ?) HOWEVER, the portion about jobs is in full agreement with my position above. Here is my main point from the author’s seven that is still my main premise:

3) Myth: An increase in the minimum wage is bad for employers

Paying a higher wage to employees can also help employers cut costs in other ways, according to the Center on Budget and Policy Priorities. “Beyond simple supply and demand theory,” reads a comprehensive report on the economics of raising the minimum wage, “increasing the minimum wage may also spur businesses to operate more efficiently and employees to work harder.”

Yes, excellent, so, “more efficiently” is the same as saying “using less labour for the same output”. That is, they’ve just said that business will fire some people as a result of the higher wages. Or, as we keep saying, there will be unemployment as a result.

I believe Chris L. posted this article as a refutation of my position — and I clearly made the points that raising minimum wage leads to loss of jobs (almost always for the poorest among us).

CONTINUING with that article:

5) Myth: It will cost us jobs and raise unemployment

So far, there is no evidence that raising the minimum wage causes an increase in unemployment or job loss. In fact, in a Goldman Sachs analysis of the 13 states which have raised their minimum wage, found that “the states where the minimum wage went up had faster employment growth than the states where the minimum wage remained at its 2013 level.”

“No evidence” is a pretty strict test to have to meet. And that statement is entirely wrong:

We estimate the minimum wage’s effects on low-skilled workers’ employment and income trajectories. Our approach exploits two dimensions of the data we analyze. First, we compare workers in states that were bound by recent increases in the federal minimum wage to workers in states that were not. Second, we use 12 months of baseline data to divide low-skilled workers into a “target” group, whose baseline wage rates were directly affected, and a “within-state control” group with slightly higher baseline wage rates. Over three subsequent years, we find that binding minimum wage increases had significant, negative effects on the employment and income growth of targeted workers. Lost income reflects contributions from employment declines, increased probabilities of working without pay (i.e., an “internship” effect), and lost wage growth associated with reductions in experience accumulation. Methodologically, we show that our approach identifies targeted workers more precisely than the demographic and industrial proxies used regularly in the literature. Additionally, because we identify targeted workers on a population-wide basis, our approach is relatively well suited for extrapolating to estimates of the minimum wage’s effects on aggregate employment. Over the late 2000s, the average effective minimum wage rose by 30 percent across the United States. We estimate that these minimum wage increases reduced the national employment-to-population ratio by 0.7 percentage point.

And:

We review the burgeoning literature on the employment effects of minimum wages – in the United States and other countries – that was spurred by the new minimum wage research beginning in the early 1990s. Our review indicates that there is a wide range of existing estimates and, accordingly, a lack of consensus about the overall effects on low-wage employment of an increase in the minimum wage. However, the oft-stated assertion that recent research fails to support the traditional view that the minimum wage reduces the employment of low-wage workers is clearly incorrect. A sizable majority of the studies surveyed in this monograph give a relatively consistent (although not always statistically significant) indication of negative employment effects of minimum wages. In addition, among the papers we view as providing the most credible evidence, almost all point to negative employment effects, both for the United States as well as for many other countries. Two other important conclusions emerge from our review. First, we see very few – if any – studies that provide convincing evidence of positive employment effects of minimum wages, especially from those studies that focus on the broader groups (rather than a narrow industry) for which the competitive model predicts disemployment effects. Second, the studies that focus on the least-skilled groups provide relatively overwhelming evidence of stronger disemployment effects for these groups.

There may be evidence you’ve not seen, evidence you don’t know about, even evidence you’d prefer not to believe but the statement that there’s no evidence is simply flat out false.

The same author in another FORBES article refutes the idea that there is “no evidence” in the Card/Krugman study, in which the idea is found via Krugman:

  • There’s just no evidence that raising the minimum wage costs jobs, at least when the starting point is as low as it is in modern America. — Paul Krugman

Said author slams this position well! As have I in a past posts:

(More Below Referencing This “Study”)

A N D, here is a article on the same topic via the DAILY SIGNAL:

1. It would be a job-killer.

The Congressional Budget Office report estimated that a $15 minimum wage would lead to 1.3 million lost jobs by the year 2025, with job losses rising over time due to compounding negative impacts.

The exact number of job losses are highly uncertain, but the report says losses would most likely range between zero and 3.7 million, with a not-insignificant chance that losses could exceed 3.7 million.

A 2011 Heritage Foundation estimate was even bleaker. It estimated a $15 minimum wage would lead to 7 million lost jobs.

Some groups have tried to minimize this part of the picture, focusing instead on the 17 million workers who currently earn below $15 that would receive an income boost. But this simply means that for every 13 workers who would get a wage boost, one worker would lose their job entirely.

Considering that a lost job can mean a family loses its home, not to mention a host of other long-term consequences, that doesn’t seem like a trade-off worth making.

One position is right, the other wrong. It may be the fact that most economists actually care about the poor and are not in Cris L.’s world all evil, greedy, GOP’ers… or as he put it: …”you’re going to post a portion of a book by a conservative economist…”

But the issue is not one economist, although he [Thomas Sowell], it really deals with history as most economists sift through it. Here, for example, is an article from FORBES:

In a comprehensive, 182-page summary of the research on this subject from the last two decades, economists David Neumark (UC-Irvine) and William Wascher (Federal Reserve Board) determined that 85 percent of the best research points to a loss of jobs following a minimum wage increase.

As in any academic discipline, there are outliers. But even the outliers are problematic: For instance, the famous (or rather, infamous) New Jersey study that associated a higher minimum with increased employment was later refuted in the same academic journal that originally published it. More recently, the paper that the President relied on to make his case for a higher minimum was debunked in a study published by the National Bureau of Economic Research.

Of course, the goal of minimum wage policy is not to reduce employment, but rather poverty. Indeed, Stevenson says explicitly in her commentary that a higher minimum wage will achieve this end. But empirical evidence refutes her point. Twenty-eight states raised minimum wages in the four years prior to passage of the last federal minimum wage increase. Economists from Cornell and American Universities, writing in the Southern Economic Journal, found no associated reduction in poverty rates….

[As an aside, I have the 182-page summary {book} mentioned in the article… I tried to find it on my book shelves, but, I am afraid I moved it to a box and placed it on my stored books pallet.]

New York is a good model as well for recent examples:

Over the past four years, the minimum wage for New York City restaurants that employ more than 10 workers went from $10.50 an hour to $15. That’s a whopping 43% increase. Next year, every restaurant, big and small, will have to pay their workers at least $15 an hour.

A big victory for workers, right? That’s how it’s depicted by the “Fight for $15” crowd. And, yes, if you held a full-time minimum-wage job over those years, your gross income would have gone up by $9,360.

But those massive wage hikes come at a painful cost that backers refuse to acknowledge. They kill jobs. Just like they’re doing right now in New York City.

In just the last three months of last year, 4,000 workers lost jobs at full-service restaurants, Bureau of Labor Statistics data show

(IBD)

And in an article referenced in the above excerpt, we find this (via AEI):

An article in the New York Eater (“Restaurateurs Are Scrambling to Cut Service and Raise Prices After Minimum Wage Hike“) highlights some of the suffering New York City’s full-service restaurants are experiencing following the December 31, 2018 hike in the city’s minimum wage to $15 an hour, which is 15.4% higher than the $13 minimum wage a year earlier, and 36.4% higher than the $11 an hour two years ago. For example, Rosa Mexicana operates four restaurants in Manhattan and estimates the $15 mandated wage will increase their labor costs by $600,000 this year. Here’s a slice:

Now, across the city, restaurant owners and operators are reworking their budgets and operations to come up with those extra funds. Some restaurants, like Rosa Mexicano, are changing scheduling. Other restaurateurs are cutting hours and staffers, raising menu prices, and otherwise nixing costs wherever they can.

And though the new regulations are intended to benefit employees, some restaurateurs and staffers say that take home pay ends up being less due to fewer hours — or that employees face more work because there are fewer staffers per shift. The bottom line is, we have to reduce the number of hours we spend,” says Chris Westcott, Rosa Mexicano’s president and CEO. “And unfortunately that means that, in many cases, employees are earning less even though they’re making more.”

In a survey conducted by New York City Hospitality Alliance late last year, about 75% of the more than 300 respondents operating full-service restaurants reported they’ll reduce employee hours this year because of the new wage increases, while 47% said they’ll eliminate jobs in 2019.

Note also that the survey also reported that “76.50% of respondents report reducing employee hours and 36.30% eliminated jobs in 2018 in response to mandated wage increases.”

So, to quote a “conservative” economist, Thomas Sowell, these raising wages — artificially, separate from the market — have consequences:

A majority of professional economists surveyed in Britain, Germany, Canada, Switzerland, and the United States agreed that minimum wage laws increase unemployment among low-skilled workers. Economists in France and Austria did not. However, the majority among Canadian economists was 85 percent and among American economists was 90 percent. Dozens of studies of the effects of minimum wages in the United States and dozens more studies of the effects of minimum wages in various countries in Europe, Latin America, the Caribbean, Indonesia, Canada, Australia, and New Zealand were reviewed in 2006 by two economists at the National Bureau of Economic Research. They concluded that, despite the various approaches and methods used in these studies, this literature as a whole was one “largely solidifying the conventional view that minimum wages reduce employment among low-skilled workers.”

[….]

Another group disproportionately affected by minimum wage laws are members of unpopular racial or ethnic minority groups. Indeed, minimum wage laws were once advocated explicitly because of the likelihood that such laws would reduce or eliminate the competition of particular minorities, whether they were Japanese in Canada during the 1920s or blacks in the United States and South Africa during the same era. Such expressions of overt racial discrimination were both legal and socially accepted in all three countries at that time.

Again, it is necessary to note how price is a factor even in racial discrimination. That is, surplus labor resulting from minimum wage laws makes it cheaper to discriminate against minority workers than it would be in a free market, where there is no chronic excess supply of labor. Passing up qualified minority workers in a free market means having to hire more other workers to take the jobs they were denied, and that in turn usually means either having to raise the pay to attract the additional workers or lowering the job qualifications at the existing pay level— both of which amount to the same thing economically, higher labor costs for getting a given amount of work done.

The history of black workers in the United States illustrates the point. As already noted, from the late nineteenth-century on through the middle of the twentieth century, the labor force participation rate of American blacks was slightly higher than that of American whites. In other words, blacks were just as employable at the wages they received as whites were at their very different wages. The minimum wage law changed that. Before federal minimum wage laws were instituted in the 1930s, the black unemployment rate was slightly lower than the white unemployment rate in 1930. But then followed the Davis-Bacon Act of 1931, the National Industrial Recovery Act of 1933 and the Fair Labor Standards Act of 1938— all of which imposed government-mandated minimum wages, either on a particular sector or more broadly.

The National Labor Relations Act of 1935, which promoted unionization, also tended to price black workers out of jobs, in addition to union rules that kept blacks from jobs by barring them from union membership. The National Industrial Recovery Act raised wage rates in the Southern textile industry by 70 percent in just five months and its impact nationwide was estimated to have cost blacks half a million jobs. While this Act was later declared unconstitutional by the Supreme Court, the Fair Labor Standards Act of 1938 was upheld by the High Court and became the major force establishing a national minimum wage. As already noted, the inflation of the 1940s largely nullified the effect of the Fair Labor Standards Act, until it was amended in 1950 to raise minimum wages to a level that would have some actual effect on current wages. By 1954, black unemployment rates were double those of whites and have continued to be at that level or higher. Those particularly hard hit by the resulting unemployment have been black teenage males.

Even though 1949— the year before a series of minimum wage escalations began— was a recession year, black teenage male unemployment that year was lower than it was to be at any time during the later boom years of the 1960s. The wide gap between the unemployment rates of black and white teenagers dates from the escalation of the minimum wage and the spread of its coverage in the 1950s. The usual explanations of high unemployment among black teenagers— inexperience, less education, lack of skills, racism— cannot explain their rising unemployment, since all these things were worse during the earlier period when black teenage unemployment was much lower. Taking the more normal year of 1948 as a basis for comparison, black male teenage unemployment then was less than half of what it would be at any time during the decade of the 1960s and less than one-third of what it would be in the 1970s.

Unemployment among 16 and 17-year-old black males was no higher than among white males of the same age in 1948. It was only after a series of minimum wage escalations began that black male teenage unemployment not only skyrocketed but became more than double the unemployment rates among white male teenagers. In the early twenty-first century, the unemployment rate for black teenagers exceeded 30 percent. After the American economy turned down in the wake of the housing and financial crises, unemployment among black teenagers reached 40 percent.

  • Thomas Sowell, Basic Economics: A Common Sense Guide to the Economy, 4th Edition (New York, NY: Basic Books, 2011), 241; 249-251

And here is more info regarding job loss as the main reason most economists are against the minimum wage… that is because employment IS THEE most important thing to poorer people (while I quote more conservative sources… they themselves are quoting more middle of the road studies):

  • Nearly 90 percent of surveyed economists believed an acceptable federal minimum wage should be less than $15 an hour. When asked what level of wage floor they would support, roughly 40 percent endorsed the current federal hourly minimum wage of $7.25 or less. And 66 percent said the minimum wage should be no higher than $10 an hour (FOX). The survey’s key findings include (PDF of survey can be found at EMPLOYMENT POLICIES INSTITUTE):
    • 74 percent oppose raising the federal minimum wage to $15 an hour;
    • 84 percent believe a $15 minimum wage will have negative effects on youth employment;
    • Two-thirds of economists (66 percent) believe that an appropriate federal minimum wage is $10 an hour or less;
    • Just six percent believe a $15 minimum wage is a very efficient means to target individuals in poverty, while 64 percent said the same thing about the Earned Income Tax Credit (EITC).
  • The nonpartisan Congressional Budget Office said Monday that raising the federal minimum wage to $15 an hour, up from the current rate of $7.25 a hour, would likely cause 1.3 million people to lose their jobs. (WASHINGTON EXAMINER)
  • Economists aren’t certain about many things, but on the minimum wage, nearly all of them (90 percent, according to one survey) believe that the case is open and shut. All else being equal, if you raise the price of something (for instance, labor), then the demand for it (for instance, by employers) will decline. That’s not just a theory; it’s a law. (James Glassman, “Don’t Raise the Minimum Wage,” Washington Post [Feb 24, 1998]
  • …percentage of economists who agree…. A minimum wage increases unemployment among young and unskilled workers. (79%) (Robert M. Beren, Professor of Economics at Harvard University ~ [More: WINTERY KNIGHT])

These specialists are not promoting “a narrative,” but displaying historical consequences as common sense economic laws.


Another Real World Example


See another post where the “Billingsley” example is used: TAX THE RICH (Plus: CEO Pay vs. Worker Pay)

My statement still stands in response to keeping people off the government doll:

Debating Minimum Wage In SEATTLE and NEW YORK CITY

So, I debated on whether to add this to our (Chris L. and myself conversation, posted HERE) earlier conversation, but, I decided to post it separately. So, in the same conversation he finally took a jaunt over to my MINIMUM WAGE portion of my ECON 101 page. He still doesn’t know why the minimum wage was used during the Davis/Bacon Act days (a), why the apartheid unions in South Africa used it (b), and why unions here use it and which community it hurts the most (c) — but at least he a c t u a l l y went to my link… and got it all wrong – lol:

An even more insidious substitution effect of minimum wages can be seen from a few quotations. During South Africa’s apartheid era, racist unions, which would never accept a black member, were the major supporters of minimum wages for blacks. In 1925, the South African Economic and Wage Commission said, “The method would be to fix a minimum rate for an occupation or craft so high that no Native would be likely to be employed.” Gert Beetge, secretary of the racist Building Workers’ Union, complained, “There is no job reservation left in the building industry, and in the circumstances, I support the rate for the job (minimum wage) as the second-best way of protecting our white artisans.” “Equal pay for equal work” became the rallying slogan of the South African white labor movement. These laborers knew that if employers were forced to pay black workers the same wages as white workers, there’d be reduced incentive to hire blacks.

South Africans were not alone in their minimum wage conspiracy against blacks. After a bitter 1909 strike by the Brotherhood of Locomotive Firemen and Enginemen in the U.S., an arbitration board decreed that blacks and whites were to be paid equal wages. Union members expressed their delight, saying, “If this course of action is followed by the company and the incentive for employing the Negro thus removed, the strike will not have been in vain.”

Our nation’s first minimum wage law, the Davis-Bacon Act of 1931, had racist motivation. During its legislative debate, its congressional supporters made such statements as, “That contractor has cheap colored labor that he transports, and he puts them in cabins, and it is labor of that sort that is in competition with white labor throughout the country.” During hearings, American Federation of Labor President William Green complained, “Colored labor is being sought to demoralize wage rates.”

Today’s stated intentions behind the support of minimum wages are nothing like yesteryear’s. However, intentions are irrelevant. In the name of decency, we must examine the effects….

The white labor unions and other white supremacists lobbied for other regulations which, in effect, prohibited blacks from being hired. These groups demanded that the hiring of blacks and other nonwhites be subject to the same compulsory employer compensation and minimum wage requirements granted to white union members. The intent of such legislation, Williams contends, is obvious. Such labor laws took away the only bar-gaming chip available to the blacks and other non-whites—their willingness to work for a lower wage. Many whites recognized this. In 1925, for example, the report of the Mining Regulations Commission proposed a mandatory system of minimum wages per job “in order to rescue the European miner from the economic fetters which at present render him the easy victim of advancing native competition.”

Contrary to the view accepted by many on the political left, apartheid is not the result of white businessmen attempting to maximize profits by enslaving cheap black labor. It is instead a product of political privilege. Says Williams:

The mere existence of South Africa’s extensive racial regulatory laws is evidence enough that racial privilege is difficult through free market forces. Consider South Africa’s job reservation laws, which mandate that certain jobs be performed by whites only . . . . The presence of job reservation laws suggests that at least some employers would hire blacks in the “white jobs.” The fact that they would hire blacks to do white jobs neither requires nor suggests that these employers be necessarily any less white supremacist than anyone else. It does suggest that those employers who would hire blacks considered such a course of action to be an attractive alternative because blacks were willing to work for lower wages—“uncivilized wages”—than white workers. The business pursuit of profits—which caused employers to be less ardent supporters of the white supremacist doc-trine-has always been the enemy of white privilege. This is why South African white workers resorted to government.

“The whole ugly history of apartheid has been an attack on free markets and the rights of individuals, and a glorification of centralized government power,” Williams concludes. Only when South Africa’s people—black, white, or colored—“de-dare war against centralized government power” will there be genuine progress toward freedom. Walter Williams’ new book provides powerful intellectual ammunition for that war.

  • Matthew B. Kibbe, FEE

(Via AEI)

There is no inherent reason why low-skilled or high-risk employees are any less employable than high-skilled, low-risk employees. Someone who is five times as valuable to an employer is no more or less employable than someone who is one-fifth as valuable, when the pay differences reflect their differences in benefits to the employer.

This is more than a theoretical point. Historically, lower skill levels did not prevent black males from having labor force participation rates higher than that of white males for every US Census from 1890 through 1930. Since then, the general growth of wage-fixing arrangements: minimum wage laws, labor unions, civil service pay scales, etc. has reversed that and made more and more blacks unemployable despite their rising levels of education and skills: absolutely and relative to whites.

And here’s the “money quote”:

In short, no one is employable or unemployable absolutely, but only relative to a given pay scale.

And that highlights the essence of the economic logic that explains why the most vulnerable workers (low-skilled, uneducated, teenagers, etc.) are the group that is most harmed by minimum wage laws — those laws artificially raise the wages of low-skilled workers without increasing their productivity, and therefore significantly reduce their employability relative to higher-skilled workers.

For example, in the study from the team of researchers at the University of Washington on Seattle’s $15 an hour minimum wage, they reported (emphasis added):

Our preferred estimates suggest that the Seattle Minimum Wage Ordinance caused hours worked by low-skilled workers (i.e., those earning under $19 per hour) to fall by 9.4% during the three quarters when the minimum wage was $13 per hour, resulting in a loss of 3.5 million hours worked per calendar quarterAlternative estimates show the number of low-wage jobs declined by 6.8%, which represents a loss of more than 5,000 jobs.

The work of least-paid workers might be performed more efficiently by more skilled and experienced workers commanding a substantially higher wage.

Bottom Line: Thomas Sowell’s comments illustrate an economic reality that is frequently overlooked: Workers compete against other workers (not employers) to find jobs and get the highest wages. Employers compete against other employers to find the best workers. In other words, low-skilled workers compete against high-skilled workers in the labor market. Low-skilled workers who would be employable at a low wage become unemployable at an artificially higher wage. And that explains the perverse cruelty of minimum wage laws: it inflicts the greatest harm on the very workers it is allegedly designed to help.

However, this is not the reason for this post. I merely wanted to show the hubris out there in stating propaganda (not intentionally, just in ignorance). Here is the portion that that I wanted to highlight and respond to. Here is the video so people can glean context:

So, here are the main points of the above:

  1. Minimum wage is still not $15.00 an hour
  2. It is $13.50 and in 2021 will be $13.69 (which he is right about, but we are talking about SEATTLE)
  3. [QUOTE] “Sean Giordano this is why I & everyone else should dismiss what ever you post. First minute & a half & anyone can prove she’s full of shit” [UNQUOTE]
  4. New York (remember, she said New York CITY) does not have $15.00 minimum wage, they are near $11.80
  5. California isn’t even over %15.00 an hour
  6. THEY ARE FULL OF SHIT!!

So my first response is to points #1 and #2

The Prager U video specifically mentions Seattle and New York City. This is key. I used two websites to find the current minimum wage in Seattle, Washington: MINIMUM-WAGE.ORG and SEATTLE GOVERNEMNT’S website. In the conversation I noted this many times, but granted, I wasn’t clear.

During the long discussion that followed a few paths, what I learned is that franchises are all included together as a large business. So if I were to franchise, say, The Brass Tap (bar/restaurant chain focuses mostly on its craft beer offerings), if the franchises nationwide have 501 employees, the tips earned do not lower the to $13.50. To make the point clearer I made a crude version:

A sad article of sorts was this one detailing the info:

Justices Reject Franchise Appeal Over Seattle’s $15 Minimum Wage (May 2, 2016)

SEATTLE — The U.S. Supreme Court will not hear a challenge to Seattle’s $15-an-hour minimum wage from franchise owners who say the law discriminates against them by treating them as large businesses.

Seattle was one of the first cities in the nation to adopt a law aiming for a $15 minimum wage, giving small businesses employing fewer than 500 people seven years to phase it in. Large employers must do so over three or four years, depending on whether they offer health insurance to their employees.

Five franchises and the International Franchise Association sued the city, saying the law treats Seattle’s 623 franchises like large businesses because they are part of multistate networks. But the franchises say they are small businesses and should have more time to phase in the higher wage.

[….]

“Seattle’s ordinance is blatantly discriminatory and affirmatively harms Seattle hard-working franchise small business owners every day since it has gone into effect,” Robert Cresanti said in a statement. “We are simply attempting to level the playing field for the 600 local franchise business owners employing 19,000 people in Seattle.”….

Remember, Seattle has a higher minimum wage than the rest of the state.

I likewise responded to points #4 thus

This comes from the NEW YORK CITY GOVERNMENTS website:

The minimum wage in New York City is $15.00 per hour. The New York State Department of Labor oversees wage regulations in New York State. Businesses employing people in New York State should be aware of wage requirements and regulations.

After December 31, 2019, all employees in New York City must be paid at least $15.00 per hour. …

#5 deals with California as a state

However, just like New York state/New York City and Washington state/Seattle, so to goes California. There are many cities in California that have differing minimum wage laws than the state. Here is just one example (click to enlarge):

So, there are a couple numbers not dealt with yet…

they are numbers #3 and #6

  • #3 [QUOTE] “Sean Giordano this is why I & everyone else should dismiss what ever you post. First minute & a half & anyone can prove she’s full of shit” [UNQUOTE]

If the opposite of Chris L’s premise is in fact shown, and if his position is “true” of me — that is: “why I & everyone else should dismiss what ever you post.” Why should I, or we, not dismiss whatever he says. I mean, he is full of shit (#6!!).

Later in the conversation discussion about the effects of minimum wage hurting restaurants, to which Chris posted the following:

I merely responded with

  • The hospitality group, which lobbies on behalf of the restaurant and hotel industry, concluded that Seattle was the hardest-hit city in Washington state, with 624 bars and bistros that have permanently shut down. (BLOG.RESTUARANT)  

So, if 29 opened up DESPITE minimum wage and covid… would the 624 be closed BECAUSE of the minimum wage and covid?


People Never PAID 90% in Taxes (Economic Myths)

This is posted for adding to a conversation from FACEBOOK where I repeatedly noted no one ever paid 90% in taxes after it was brought up by my antagonist — hoping the operative word “PAID” would sink in — (conversation reproduced at the end of this post for clarity — JUMP.) Other Posts that discuss related issues:

90% MYTH

(From the video):

  • “economic historian Phil Magness, of the American Institute for Economic Research, says that progressives miss an important fact: The high tax rates that America had in the past actually didn’t bring in much revenue. When rates were at 70 percent, Magness tells John Stossel, ‘A millionaire on average would pay 41 percent’.”

Even “CheckYourFact” says this:

  • While the top marginal income tax rate was over 90 percent [92%] while Eisenhower was president, few people were subject to that rate due to deductions and other tax loopholes. Top income earners paid much lower average tax rates.

(MISES.ORG has an excellent article dealing with the 90% issue, as well as GREY ENLIGHTENMENT)

ALMOST CLASSICAL notes this in their “The 90% Tax Rate Myth” post:

So, let’s get more complicated. When there was a 94% top rate in 1944-45, there were so many deductions and exclusions that the taxable income was not comparable to someone’s entire income. First, the top rate started at $200,000, which today is equal to $2,413,059.90 — so the maximum EMTR would apply only to incomes of $2.5 million. But, that’s still taxable income, not earned income.

In 1944, you could deduct business meals, all business travel, all forms of interest payments, and much more. You could even deduct spousal travel expenses on a business trip! (Why travel alone?) Companies could also “loan” or “provide” almost anything to an employee, from an apartment to standard benefits. It was possible to shelter tens of thousands of dollars from taxable income. Three-martini lunches and expense accounts were important realities, skewing tax calculations.

As a result of deductions and exclusions, even the theoretical maximum Real Rate of taxation at 60% in 1944 overstates taxation dramatically. The reality? On earned income, the richest U.S. taxpayers paid close to 40 percent of their earned incomes in taxes in 1944. We simply didn’t count much of the compensation as taxable income.

Allow me to introduce you to Hauser’s Law. Published in 1993 by William Kurt Hauser, a San Francisco investment economist, Hauser’s Law suggests, “No matter what the tax rates have been, in postwar America tax revenues have remained at about 19.5% of GDP.” This theory was published in The Wall Street Journal, March 25, 1993. For a variety of reasons, we seem to balance tax collections within a narrow range.

Since 1945, U.S. federal tax receipts have been fairly constant in terms of Gross Domestic Product (GDP), with taxes ranging from 15 to 20 percent of GDP. The graph is as follows:

When people demand higher taxes on the rich, usually phrased as paying a “fair share,” they are ignoring how our tax system has functioned historically. We could create more brackets, to tax the top 1% at a higher rate once again, but the net increase in tax revenues wouldn’t be dramatic. Why not? Because government spending is near historical highs: we are spending at near-WWII levels. It would be nearly impossible to tax enough to pay the federal bills, and doing so would likely crush the economy….

CREATING MORE REVENUE

So, what did JFK’s “the rising tide lifts all the boats,” Reagan’s tax cuts and Bush’s tax cuts show? (See: John F. Kennedy and Ronald Reagan Proved Tax Cuts Work“) That lower taxes brings in more revenue.

  • Should tax rates be higher? It’s the million dollar question! Up? Down? No change? Where in the world should taxes go? In election years, the question of tax rates fills the airwaves. In non-election years, the question of tax rates, again, fills the airwaves. So what’s the answer? UCLA Professor of Economics Tim Groseclose explains his research on the topic. Basically, there’s a certain point at which higher tax rates actually reduce the amount of revenue the government collects. What’s that point? When are tax rates too high? Learn a valuable lesson in economics, and public policy.

Which is why either a national sales tax or a flat tax would help fuel our GDP engine more. Thomas Sowell further explains via an excerpt (my scan from my book) of the “conclusion” of Thomas Sowell’s “The World of Numbers.” You can listen to the entirety of chapter 4 read via MIKE READS: Chpt 4(a) | Chpt 4(b).

I will also emphasize AEI’s PARTIAL QUOTE from my expanded quote — it has changed a bit due to my having the revised edition (as usual I add the references for people to further follow the rabbit trail):

THOMAS SOWELL

  • Thomas Sowell, Discrimination and Disparities: Revised and Enlarged Edition (New York, NY: Basic Books, 2019), 110-114; (references), 255-257.

IMPLICATIONS

The emphasis on complex statistical analysis in economics and other fields— however valuable, or even vital, such statistical analysis may be in many cases— can lead to overlooking simple but fundamental questions as to whether the numbers on which these complex analyses are based are in fact measuring what they seem to be measuring, or claim to be measuring. “Income” statistics which lump together annual salaries and multi-year capital gains are just one of many sets of statistics which could stand much closer scrutiny at this fundamental level— especially if laws and policies affecting millions of human beings are to be based on statistical conclusions.

What can be disconcerting, if not painful, are the simple and obvious fallacies that can pass muster in intellectual circles when these fallacies seem to advance the prevailing vision of what is called “social justice.” Among prominent current examples is French economist Thomas Piketty’s large international statistical study of income inequality, which was instantly acclaimed in many countries, despite such obvious and fundamental misstatements as one pointed out by Professor Steven Pinker of Harvard:

Thomas Piketty, whose 2014 bestseller Capital in the Twenty-First Century became a talisman in the uproar over inequality, wrote, “The poorer half of the population are as poor today as they were in the past, with barely 5 percent of total wealth in 2010, just as in 1910.” But total wealth today is vastly greater than it was in 1910, so if the poorer half own the same proportion, they are far richer, not “as poor.”66

In addition to speaking of percentages as if they represented a given amount of income or wealth over the course of a century, Professor Piketty also made such assertions as that, in income, “the upper decile is truly a world unto itself,”67 when in fact just over half of all Americans are in that upper decile at some point in their lives.68 When Piketty said that the top one percent sit atop the “hierarchy” and “structure of inequality,”69 he again verbally transformed a changing mix of people in particular income brackets into a fixed structure rather than a fluid process, in which most Americans do not remain in the same quintile from one decade to the next.

Such misstatements are different expressions of the same fundamental misconception. As an empirical study of the 400 richest Americans pointed out, Piketty “naively assumes that it’s the same people getting richer.”70 But the majority of the 400 richest Americans have earned their fortunes in their own lifetimes, rather than being heirs of the 400 largest fortunes of the past!71

Such misconceptions are not peculiar to Professor Piketty. Nor are these the only problems with his statistics. But that such simple and obvious misstatements can pass muster in intellectual circles is a problem and a danger that goes far beyond Thomas Piketty.

Whether income differences are measured before taxes or after taxes can change the degree of inequality. If inequalities are measured both after taxes and after government transfers, whether in money or in goods and services, that can reduce the inequality considerably, when high-income people pay higher taxes and low-income people receive most of the government transfers.

Statistics on tax rates themselves can be grossly misleading when changes in tax rates are described in such terms as “a $300 billion increase in taxes” or “a $300 billion decrease in taxes.In reality, all that the government can do is change the tax rate. How much tax revenue that will produce depends on how people react. There have been times when higher tax rates have produced lower tax revenues, and other times when lower tax rates have produced higher tax revenues,72 as well as times when tax rates and tax revenues moved in the same direction.

During the 1920s, for example, the tax rate on the highest income Americans was reduced from 73 percent to 24 percent— and the income tax revenue rose substantially73— especially income tax revenues received from people in the highest income brackets. Under the older and much higher tax rate, vast sums of money from wealthy investors were sheltered in tax-exempt securities, such as municipal bonds. The total amount of money invested in tax-free securities was estimated to be three times the size of the annual budget of the federal government, and more than half as large as the national debt.74

Such vast and legally untaxable sums of money caught the attention and aroused the ire of Secretary of the Treasury Andrew Mellon, who declared it “repugnant” in a democracy that there should be “a class in the community which cannot be reached for tax purposes.”75 Failing to get Congress to take steps toward ending tax exemptions for incomes from particular securities,76 Secretary Mellon sought instead to lower the tax rates to the point where it would in fact lead to collection of more tax revenues.

Tax-exempt securities tend not to pay as high a rate of return on investments as other securities, whose earnings are taxed. It made sense for wealthy investors to accept these lower rates of return from tax-exempt securities when the tax rate was 73 percent, but not after the tax rate was lowered to 24 percent. In terms of words on paper, the official tax rate on the highest incomes was cut from 73 percent to 24 percent in the 1920s. But, in terms of events in the real world, the tax rate actually paid— on staggering sums of money previously untouchable in tax shelters— rose from zero percent to 24 percent. This produced huge increases in tax revenues received from high-income people, both absolutely and as a percentage of all income taxes collected.77

This increase in income taxes collected from high-income taxpayers was a result of the plain fact that 24 percent of something is larger than 73 percent of nothing. Tax rate cuts in some later administrations also led to increases in tax revenues!78 For example, a front-page news story in the New York Times of July 9, 2006 said: “An unexpectedly steep rise in tax revenues from corporations and the wealthy is driving down the projected budget deficit this year.79

However unexpected this increase in tax revenues may have been to the New York Times and others decrying “tax cuts for the rich,” this was precisely the kind of outcome predicted and expected by others in various administrations over the years, who had urged that tax rates be cut, in order to get money disgorged from tax shelters and invested in the market economy. This included people in the Coolidge, Kennedy, Reagan and George W. Bush administrations, where there were similar outcomes.80 But the very possibility that tax rates and tax revenues can move in opposite directions is seldom mentioned in the media— a crucial error of omission.

These are not simply arguments about history. Among the consequences in our own time is that proposals to reduce income tax rates are automatically met with objections to reducing income tax revenues. In the Wall Street Journal of January 31, 2018, for example, economist Alan Blinder objected to tax rate cuts on grounds that “the deficit is already too large!”81

This is in defiance of what the New York Times reported about the unexpected reduction of the deficit by increased tax revenues during the administration of President George W. Bush. It is also in defiance of a record-breaking budget surplus after tax rates were reduced in the 1920s— a surplus large enough to allow about one-fourth of the national debt to be paid off.82 Like many others, Professor Blinder proceeded as if it were axiomatic that tax rate reductions mean tax revenue reductions.

There is, of course, no guarantee of what any given tax rate reduction will lead to in a given set of circumstances. But Professor Blinder’s assertion was not based on any argument that a tax rate reduction under particular current circumstances would lead to a reduction in tax revenues. There was in fact no argument whatever on that point, nor apparently any sense of need to make such an argument. Similarly, a twenty-first century book on President Calvin Coolidge likewise asserted that, as a result of the tax rate cuts during his administration, “the bounty that the rich enjoyed sapped the U.S. Treasury of funds it might have used for other ends.”83 Thus a record-breaking budget surplus under President Coolidge was verbally transmuted into a deprivation of funds, with the turn of a phrase.

All the voluminous and detailed statistics on tax rates and tax revenues published by the Internal Revenue Service, going back more than a hundred years, might as well not exist, as far as many of those with the prevailing social vision are concerned. This is ultimately not a question about history, but about what such heedlessness implies for the present and still more so for the future.

REFERENCES

66 Steven Pinker, Enlightenment Now: The Case for Reason, Science, Humanism, and Progress (New York: Viking, 2018), p. 99.

67 Thomas Piketty, Capital in the Twenty-First Century (Cambridge, Massachusetts: Harvard University Press, 2014), p. 252.

68 Thomas A. Hirschl and Mark R. Rank, “The Life Course Dynamics of Affluence,” PLoS ONE, January 28, 2015, p. 5.

69 Thomas Piketty, Capital in the Twenty-First Century, p. 278.

70 Robert Arnott, William Bernstein, and Lillian Wu, “The Myth of Dynastic Wealth: The Rich Get Poorer,” Cato Journal, Fall 2015, p. 461.

71 “Spare a Dime,” a special report on the rich, The Economist, April 4, 2009, p. 4.

72 See, for example, Phil Gramm and John F. Early, “The Myth of American Inequality,” Wall Street Journal, August 10, 2018, p. A15. See also Thomas Sowell, Basic Economics: A Common Sense Guide to the Economy, fifth edition (New York: Basic Books, 2015), pp. 426-427, 428.

73 Gene Smiley and Richard Keehn, “Federal Personal Income Tax Policy in the 1920s,” Journal ofEconomic History, Vol. 55, No. 2 (June 1995), p. 286; Benjamin G. Rader, “Federal Taxation in the 1920s,” The Historian, Vol. 33, No. 3 (May 1971), p. 432; Burton W. Fulsom, Jr., The Myth of the Robber Barons: A New Look at the Rise of Big Business in America, sixth edition (Herndon, Virginia: Young America’s Foundation, 2010), pp. 108, 115, 116.

74 Burton W. Fulsom, Jr., The Myth of the Robber Barons, sixth edition, p. 109.

75 Andrew W. Mellon, Taxation: The People’s Business (New York: The Macmillan Company, 1924), p. 170.

76 Gene Smiley and Richard Keehn, “Federal Personal Income Tax Policy in the 1920s,” Journal of Economic History, Vol. 55, No. 2 (June 1995), p. 289.

77 Burton W. Fulsom, Jr., The Myth of the Robber Barons, sixth edition, p. 116. The share of income tax revenues paid by people with incomes up to $50,000 a year fell, and the share of income tax revenues paid by people with incomes of $100,000 and up increased. At the extremes, taxpayers in the lowest income bracket paid 13 percent of all income tax revenues in 1921, but less than half of one percent of all income taxes in 1929, while taxpayers with incomes of a million dollars a year and up saw their share of income taxes paid rise from less than 5 percent to just over 19 percent. Gene Smiley and Richard Keehn, “Federal Personal Income Tax Policy in the 1920s,”Journal ofEconomic Histoy, Vol. 55, No. 2 (June 1995), p. 295; Benjamin G. Rader, “Federal Taxation in the 1920s,” The Historian, Vol. 33, No. 3 (May 1971), pp. 432-434.

78 Alan Reynolds, “Why 70% Tax Rates Won’t Work,” Wall Street Journal, June 16, 2011, p. A19; Stephen Moore, “Real Tax Cuts Have Curves,” Wall Street Journal, June 13, 2005, p. A13. Professor Joseph E. Stiglitz argued that the tax rate cuts during the Reagan administration failed: “In fact, Reagan had promised that the incentive effects of his tax cuts would be so powerful that tax revenues would increase. And yet, the only thing that increased was the deficit.” Joseph E. Stiglitz, The Price of Inequality (New York: W.W. Norton, 2012), p. 89. However, the tax revenues collected by the federal government during every year of the Reagan administration exceeded the tax revenues collected in any previous administration in the history of the country. Economic Report of the President: 2018 (Washington: Government Printing Office, 2018), p. 552; U. S. Bureau of the Census, Historical Statistics of the United States, Part 2, pp. 1104-1105. The deficit reflected the fact that there is no amount of money that Congress cannot outspend.

79 Edmund L. Andrews, “Surprising Jump in Tax Revenues Curbs U.S. Deficit,” New York Times, July 9, 2006, p. Al.

80 James Gwartney and Richard Stroup, “Tax Cuts: Who Shoulders the Burden?” Federal Reserve Bank of Atlanta Economic Review, March 1982, pp. 19-27; Benjamin G. Rader, “Federal Taxation in the 1920s: A Re-examination,” Historian, Vol. 33, No. 3, p. 432; Burton W. Folsom, Jr., The Myth of the Robber Barons, sixth edition, p. 116; Robert L. Bartley, The Seven Fat Years: And How to Do It Again (New York: The Free Press, 1992), pp. 71-74; Alan Reynolds, ‘Why 70% Tax Rates Won’t Work,” Wall Street Journal, June 16, 2011, p. A19; Stephen Moore, “Real Tax Cuts Have Curves,” Wall Street Journal, June 13, 2005, p. A13; Economic Report of the President: 2017 (Washington: Government Printing Office, 2017), p. 586. See also United States Internal Revenue Service, Statistics of Income 1920-1929 (Washington: Government Printing Office, 1922-1932).

81 Alan S. Blinder, “Why Now Is the Wrong Time to Increase the Deficit,” Wall Street Journal, January 31, 2018, p. A15.

82 The national debt, which was a little over $24 billion in 1920— the last year of President Woodrow Wilson’s administration— was reduced to less than $18 billion in 1928, the last year of President Calvin Coolidge’s administration. U. S. Bureau of the Census, _Historical Statistics ofthe United States, Part 2, p.1104. See also David Greenberg, Calvin Coolidge (New York: Times Books, 2006), p. 67.

83 David Greenberg, Calvin Coolidge, p. 72.


CONVERSATION


Minimum Wage Cost Me My Job (PragerU)

What happens when politicians decide they are in a better position than business owners to know how much workers should be paid? We don’t have to guess. Cities like Seattle and New York have already done so with their $15/hour minimum wage mandates. Simone Barron, a lifelong restaurant worker, recounts how “helping” her impacted her wallet, her career, and her life.

The Blue State [Jobs] Crush

Rush Limbaugh on Friday’s show (May 15th) took a call that led him to an important response that places like New York that survive off of their Manhattan business district may lose [permanently] large corporations renting out the office space and paying the high cost of taxes that fund the city and are a large portion of taxes. The people that live and work in the tri-state areas that are also connected to making New York City run (BLUE COLLAR: maintenance, janitorial, tech, etc.) as well as all the business professionals (WHITE COLLAR: administrators, human resources, lawyers, etc.). Not only that, but the new laws and enforcements like these seen in this pandemic may be a cost for companies moving their offices to other states.

Here is an excellent article by the NEW YORK TIMES:

  • Manhattan Faces a Reckoning if Working From Home Becomes the Norm: Even after the crisis eases, companies may let workers stay home. That would affect an entire ecosystem, from transit to restaurants to shops. Not to mention the tax base

Here are a couple other note-worthy articles:

  • Manhattan New Rentals Plunge 71% as Coronavirus Freezes Market (NBC – NECN)
  • Would Gov. Cuomo Rather Have No Businesses in New York Than Businesses That Employ Fewer People? His proposed law would require that corporations return bailout funds if they don’t rehire the same number of employees (REASON)
  • ‘If It Saves Just One Life’: Layoffs Start to Hit Media and Suddenly They Notice the Problem (RED STATE)
  • 100,000 Businesses Have Permanently Collapsed Under Pandemic Lockdowns (THE FEDERALIST)

Socialism Ruined, RUINED, Venezuela! (UPDATED 3-27-2020)

UPDATED VIDEO by REASON TV:

People who fled Cuba and Venezuela warn Americans not to embrace socialism.

See more via my SOCIALISM links

Media personalities claim socialism didn’t cause Venezuela’s collapse, but it did.

POWERLINE sets the idea of “what socialism really is” when they note…

My one quibble is the assumption that Venezuela exemplifies income equality along with socialism. In fact, relatives and friends of the Chavez/Maduro regime have made off with billions while the majority went hungry. Socialism always leads to this kind of stark inequality. As I wrote at the link:

  • [T]hat is what socialism is all about: great wealth and power for a handful, poverty and humiliation for the vast majority.

Venezuela is in the midst of economic and social collapse. Which country do you think liberals would love to model our country after?

Stossel has an exchange with famed M.I.T. linguist Noam Chomsky, who once praised former President Hugo Chávez socialist policies.

(H-T to PHIL FERNANDES) Rafael Acevedo is Founder Director of Econintech, and teaches at the Universidad Centroccidental Lisandro Alvarado in Barquisimeto. He is also Director of Politics of the Venezuelan Freedom Movement.

The longer speech by Rafael Acevedo of which the above is a truncation is HERE. Dinesh D’Souza’s wife ,Debbie D’Souza, a native Venezuelan, did a PRAGERU video as well:

We’ve read and watched the news of Venezuelan society collapsing under the weight of socialism. But how bad is it really? See this firsthand account from documentary filmmaker Ami Horowitz.

Dennis Prager first read from an AP story about Jamie Foxx visiting the death hole known as Venezuela (see the FREE REPUBLIC’S POST). Later in the show he actually gets a call from Caracas, Venezuela. I teared up a bit during the call, as did Prager apparently. Good stuff Maynard!

Here is Dennis’ Facebook comment:

Actor Jamie Foxx will pay no price for his visit with Venezuela President Maduro. A rare combo of doing evil — supporting a brutal dictator — and being stupid. Foxx will get picked up by a limo and go home to his mansion in California while the people of Venezuela starve and wait in line for toilet paper thanks to the socialist revolution.

Leftists don’t care about people, they care about ideas. This is Jamie Foxx. He care doesn’t care about the Venezuelan people. He cares about an idea. He loves the idea of equality. It’s painful. Just painful. Will there be a price paid for such radical stupidity? There is nothing a a left-winger could do that would elicit criticism.

Trump Stepping Into Obama’s Bailout Failure

(EPOCH TIMES article linked in pic above)

I grabbed this from my phone, because it is behind a WALL STREET JOURNAL paywall otherwise (for whatever reason my phone got the text?). Enjoy Art Laffer and Stephen Moore:

  • Obama’s Bad Stimulus Example: Democrats want to repeat the 2009 strategy of paying Americans not to work.

President Trump is negotiating with Congress over a massive stimulus plan to combat the severe economic and financial fallout from the coronavirus. One idea that seems to be catching on is a check of up to $1,200 to be mailed to every American, while Democrats in Congress want paid-leave policies and expanded welfare benefits. These may provide some needed temporary relief for families but are unlikely to help lift the economy. Keynesian stimulus almost always fails, and often makes the downturn worse and the eventual recovery weaker.

Mr. Trump would be wise to learn the lessons from Barack Obama’s $830 billion American Recovery and Reinvestment Act of 2009. In the wake of the housing meltdown and financial crisis, Congress passed the largest stimulus-spending package in American history. The economic spark and job creation were supposed to appear almost immediately, as money flowed into “shovel ready” construction projects. Vice President Joe Biden barnstormed around the country in 2010 promising a “Summer of Recovery” that never came.

One problem apparent from the start was that only about 15% of the money was used for roads, bridges and other infrastructure projects. More than twice as much went to income-redistribution programs such as Medicaid, food stamps and extended unemployment insurance, or to green-energy projects. Remember the federally subsidized “cash for clunkers” auto trade-in program? That sop to the auto industry did little to shore up employment—or even the auto industry. University of Chicago economist Casey Mulligan calls the postcrisis downturn the “redistribution recession.”

The left is now trumpeting the redistributive stimulus as a wondrous success. Mr. Obama even tweeted earlier this year that his stimulus plan laid the groundwork for “more than a decade of economic growth.” But the facts point in the opposite direction. When his stimulus plan passed, Mr. Obama’s economic team predicted above 4% growth each year from 2011 through 2013.

Fortune tellers with tarot cards and Ouija boards might have gotten closer to the mark. On average, growth from 2009 to 2012 was a mere 2%. Two years after the stimulus the unemployment rate was still 9%, and it would have been much higher if not for the millions of Americans who dropped out of the labor force because jobs were so scarce. The plan was designed to help the middle class, but median household income fell through 2011.

In 2015 the Joint Economic Committee of Congress compared the Obama recovery with the previous eight recessions and found that per capita income growth after 2009 was thousands of dollars below the average. The JEC’s conclusion summarizes the legacy of the Obama stimulus: “On economic growth the Obama recovery ranks dead last.”

To paint a rosy picture, Democrats have had to argue that the economy would have been even worse, bordering on a second Great Depression, without all of the spending. Yet their outlook before passing the stimulus exposes that argument as a mere shifting of goal posts. Actual job growth after 2009 was lower than what Mr. Obama’s economic team predicted it would have been without the hundreds of billions in spending. That’s some “investment.”

Then as now, Nancy Pelosi was speaker of the House. Her strategy was, as Mr. Obama’s chief of staff put it, not to let a crisis “go to waste.” The 2009 stimulus morphed into a giant welfare bill—by design. Mrs. Pelosi said back then that spending money on food stamps and unemployment insurance was “fast acting” and “fiscally possible,” and that these programs could deliver a surplus of economic activity for every dollar spent. Magically, paying people not to work was supposed to get more people to work.

Now she is peddling the same economic non sequiturs, hoping to salvage employment while passing two weeks of paid leave for employers with fewer than 500 workers, beefed-up unemployment insurance, and other redistribution programs at a price tag of hundreds of billions of dollars. Democrats even tried to make the paid-leave provision permanent. All this spending will decrease the number of Americans who return quickly to work after the crisis.

Given the current public-health strategy of social distancing, providing cash and in-kind benefits to tens of millions of stranded workers may be a prudent and compassionate approach. But no one should pretend these programs will stimulate recovery. They are likelier to prolong a slump, as the Obama strategy did. President Trump should beware: Another redistribution recession might even ensure that Joe Biden takes his job in November.

A much simpler and more effective stimulus would be a pro-growth tax cut, such as a suspension of the payroll tax. In addition to boosting take-home pay, it would give 27 million small businesses an incentive to hire rather than fire.

Mr. Laffer is chairman of Laffer Associates. Mr. Moore is a senior fellow at the Heritage Foundation. They are authors of “Trumponomics: Inside the America First Plan to Revive Our Economy.”


Red States vs. Blue States (Supply-n-Demand)

I wanted to share two articles to exemplify and introduction to a HERITAGE FOUNDATION article about competition between states. The first is this article found over at HOT AIR, and it shows the damage that distortions to supply and demand for some sort of egalitarian or environmental concern can have on productive endeavors that increase the wealth of the common man. Wealth creation in other words:

If you know anything about New York in the modern era (both the state and the Big Apple), you’re likely aware that it’s not exactly a friendly landscape for the oil and gas industry. The “Keep it in the ground” crowd has a lot of influence with the Democrats who control the government. That[‘s] why, back in 2013, when the new Constitution Pipeline was proposed to carry natural gas from Pennsylvania’s rich shale oil fields to New York, activists were able to block the construction despite it already having been approved by federal regulators. Similarly, when National Grid (the local energy consortium) requested an extension to the Williams Co. Transco pipeline, they were also tied up because of the outcry from environmental activists.

Here comes the surprise that nobody could have possibly seen coming. The city and its surrounding downstate region are still expanding with new construction projects, but their energy suppliers have told them that they will not be able to supply natural gas to any new customers because they’re already at capacity. (NY Post)

Long Islanders were recently hit with bad news. National Grid, which provides natural gas for nearly 600,000 Long Island residents, announced it won’t be able to provide fuel for new customers if the proposed Williams Co. Transco pipeline expansion isn’t approved by May 15.

Earlier this year, energy company Con Ed imposed a similar moratorium on new natural-gas service in parts of Westchester County due to limited capacity on existing pipelines. These crises are completely avoidable…

For too long, politicians like Gov. Andrew Cuomo and their ill-considered energy policies have hampered the development of safe, efficient energy infrastructure, subjecting American consumers to unnecessarily high energy costs and unreliable service.

So you don’t want pipelines, eh? But you say you’d like to build more houses, apartments and office buildings? Well, you’d better figure out how to cook your food and heat your living spaces with solar panels pretty quickly because (to borrow a phrase from GoT) winter is coming. And so is lunchtime…..

The second article deals with on the one hand a Utopian [mis]understanding of alternative energy and it’s own “supply-and-demand” features built into the environmentalist hypothesis (that in the end do not fit reality). I have said for years that the supply of heavy metals and lithium which are the main ingredient to make power cells for cell phones and laptops (small/reasonable), to a whole swath of them in rows in electric cars (unreasonable).

Let me explain why I just said “unreasonable.” These ventures with Tesla and other manufacturers of electric vehicles are not a “supply-and-demand” by the free market. These ventures into wind, solar, and electric vehicles ONLY EXIST because our government has funded their “viability” in a world that if left to stand on their own would go out of business. The technology is old and never really worked, and the only people that buy Teslas, as an example, are the rich, and they are given a form of welfare to do so. (In other words, the rich are getting a form of bailout by environmentalists that say the rich are ruining the environment.)

Here is POWERLINE’S article in part:

“Green” advocates aspire to power the entire U.S. electrical system with wind and solar energy. How are they going to do that, given that wind turbines produce electricity only around 40% of the time, and solar panels produce electricity, in most areas, less than 25% of the time? The truthful answer is that whenever utilities build (or contract with) a wind farm or a solar installation, they also build a natural gas plant to provide electricity during the majority of the time when the “green” resources are idle. This is why wind and solar energy, unlike nuclear power, actually lock us into fossil fuel use for the indefinite future.

Of course, green power advocates don’t admit that they plan on using natural gas forever. They hold out hope that electricity produced by wind and solar facilities will be stored in batteries–giant ones, I assume–so that it can be used when the wind doesn’t blow and the sun doesn’t shine. No such batteries exist, of course, which is why they are not already in use. And any existing or foreseeable battery technology would rely on vast amounts of lithium, which must be mined.

Currently, the Chinese are “rush[ing] to dominate the global supply of lithium.” We do have lithium deposits in the United States, notably in the Panamint Valley of California. The Los Angeles Times reports: “A war is brewing over lithium mining at the edge of Death Valley.”

Recently, the Australia-based firm Battery Mineral Resources Ltd. asked the federal government for permission to drill four exploratory wells to see if the hot, salty brine beneath the valley floor contains economically viable concentrations of lithium. …

The drilling request has generated strong opposition from the Center for Biological Diversity, the Sierra Club and the Defenders of Wildlife, who say the drilling project would be an initial step toward the creation of a full-scale lithium mining operation.

That is the idea, I suppose.

[….]

Does it matter? There is great demand for lithium used in existing technologies–phones, laptops, electric vehicles, and so on. But the idea that batteries of any foreseeable design will combine with wind turbines and solar panels to satisfy America’s need for electricity is a fantasy. For one thing, batteries of the requisite capacity would be prohibitively expensive. It has been calculated that, using the most advanced battery technology on the market, Tesla’s 100 MW, 129 MWh battery in use in South Australia, it would cost $133 billion to store the electricity needs of my state, Minnesota, for 24 hours. That is more than one-third of the state’s annual GDP…..

AGAIN, the immutable law of supply-and-demand will come into play in rising prices of “alternative energy” and scarcity of availability… based on egalitarian environmental concerns. N O W, here is the intro to the HERITAGE FOUNDATION article noting the differences between blue-state policies and red-state policies… much of which is based on supply-and-demand regarding energy needs:

The competition among the states is becoming more intense as businesses become more mobile. Toyota and Boeing are two high-profile employers in America that have crossed state borders because of the policy advantages of one state over another. Toyota moved from high-income-tax California to no-income-tax Texas, and Boeing, based in Washington, a forced-union state, opened a new plant in South Carolina, which has a right-to-work (RTW) law. Texas Governor Rick Perry and California Governor Jerry Brown have openly sparred in recent years about which state is more pro-business. Interstate competition allows governors and legislators to learn from each other about which policies create wealth and which policies diminish wealth inside their borders.

In recent years, governors have generally divided into two competing camps, which we call the “red state model” and the “blue state model,” raising the stakes in this interstate competition. The conservative red state model is predicated on low tax rates, right-to-work laws, light regulation, and pro-energy development policies. This policy strategy is now common in most of the Southern states and the more rural and mountain states. Meanwhile, the liberal blue state model is predominantly found in the Northeast, California, Illinois, Minnesota, and, until recently, Michigan and Ohio. The blue states have doubled down on policies that include high levels of government spending, high income tax rates on the rich, generous welfare benefits, forced-union requirements, super-minimum-wage laws, and restrictions on oil and gas drilling.

In no area are the effects of these competing models more evident than in tax policy changes of recent years. California, Connecticut, Hawaii, Illinois, Minnesota, New York, and Oregon have raised their income tax rates on “the rich” since 2008.[1] In four of these states, the combined state and local income tax rate exceeds 10 percent, reaching 13.3 percent in California and 12.7 percent in New York.[2] Meanwhile, the “red states” of Arizona, Arkansas,[3] Kansas,[4] Missouri,[5] North Carolina, Oklahoma, and Idaho[6] have cut their tax rates. This has widened the income tax differential between blue states and red states for businesses and upper-income families.

Similarly, red states such as Oklahoma, Texas, and North Dakota have embraced the oil and gas drilling revolution in America. Blue states such as New York, Vermont, Illinois, and California have resisted it. Blue states have raised their minimum wages; red states generally have not.

In this study, which is a summary of our recent book with Rex Sinquefield and Travis Brown, An Inquiry into the Nature and Causes of the Wealth of States: How Taxes, Energy, and Worker Freedom Will Change the Balance of Power Among States, we examine whether these policy differentials matter and, if so, by how much.

The answer is that the states’ policy choices on taxes, regulation, energy policy, labor laws, educational choice, and so forth have a large and in most cases a statistically significant impact on the prosperity of states over each 10-year time frame examined on a rolling basis from 1970 to 2012. There are always exceptions to the rule, but in most cases the red state model is substantially outperforming the blue state model.

We find in particular that two policies matter most. Right-to-work states substantially outperform non–right-to-work states, and states with no or low income taxes have a much better economic record than high-income-tax states…..

GPA Redistribution – It’s Only Fair

Would college students support a policy that would force those with high GPAs to donate part of their own GPA to help those with lower grades? With the recent rise of politicians like Bernie Sanders and Alexandria Ocasio-Cortez, more people than ever support socialist policies. But would they support socialist policies when it came to their GPA? We went to Florida International University to find out.

Here is an old one not set-up as well: Every year college YAF chapters submit a GPA Redistribution video, and this year, Davidson won (h-t, ACE OF SPADES):